Product Analytics
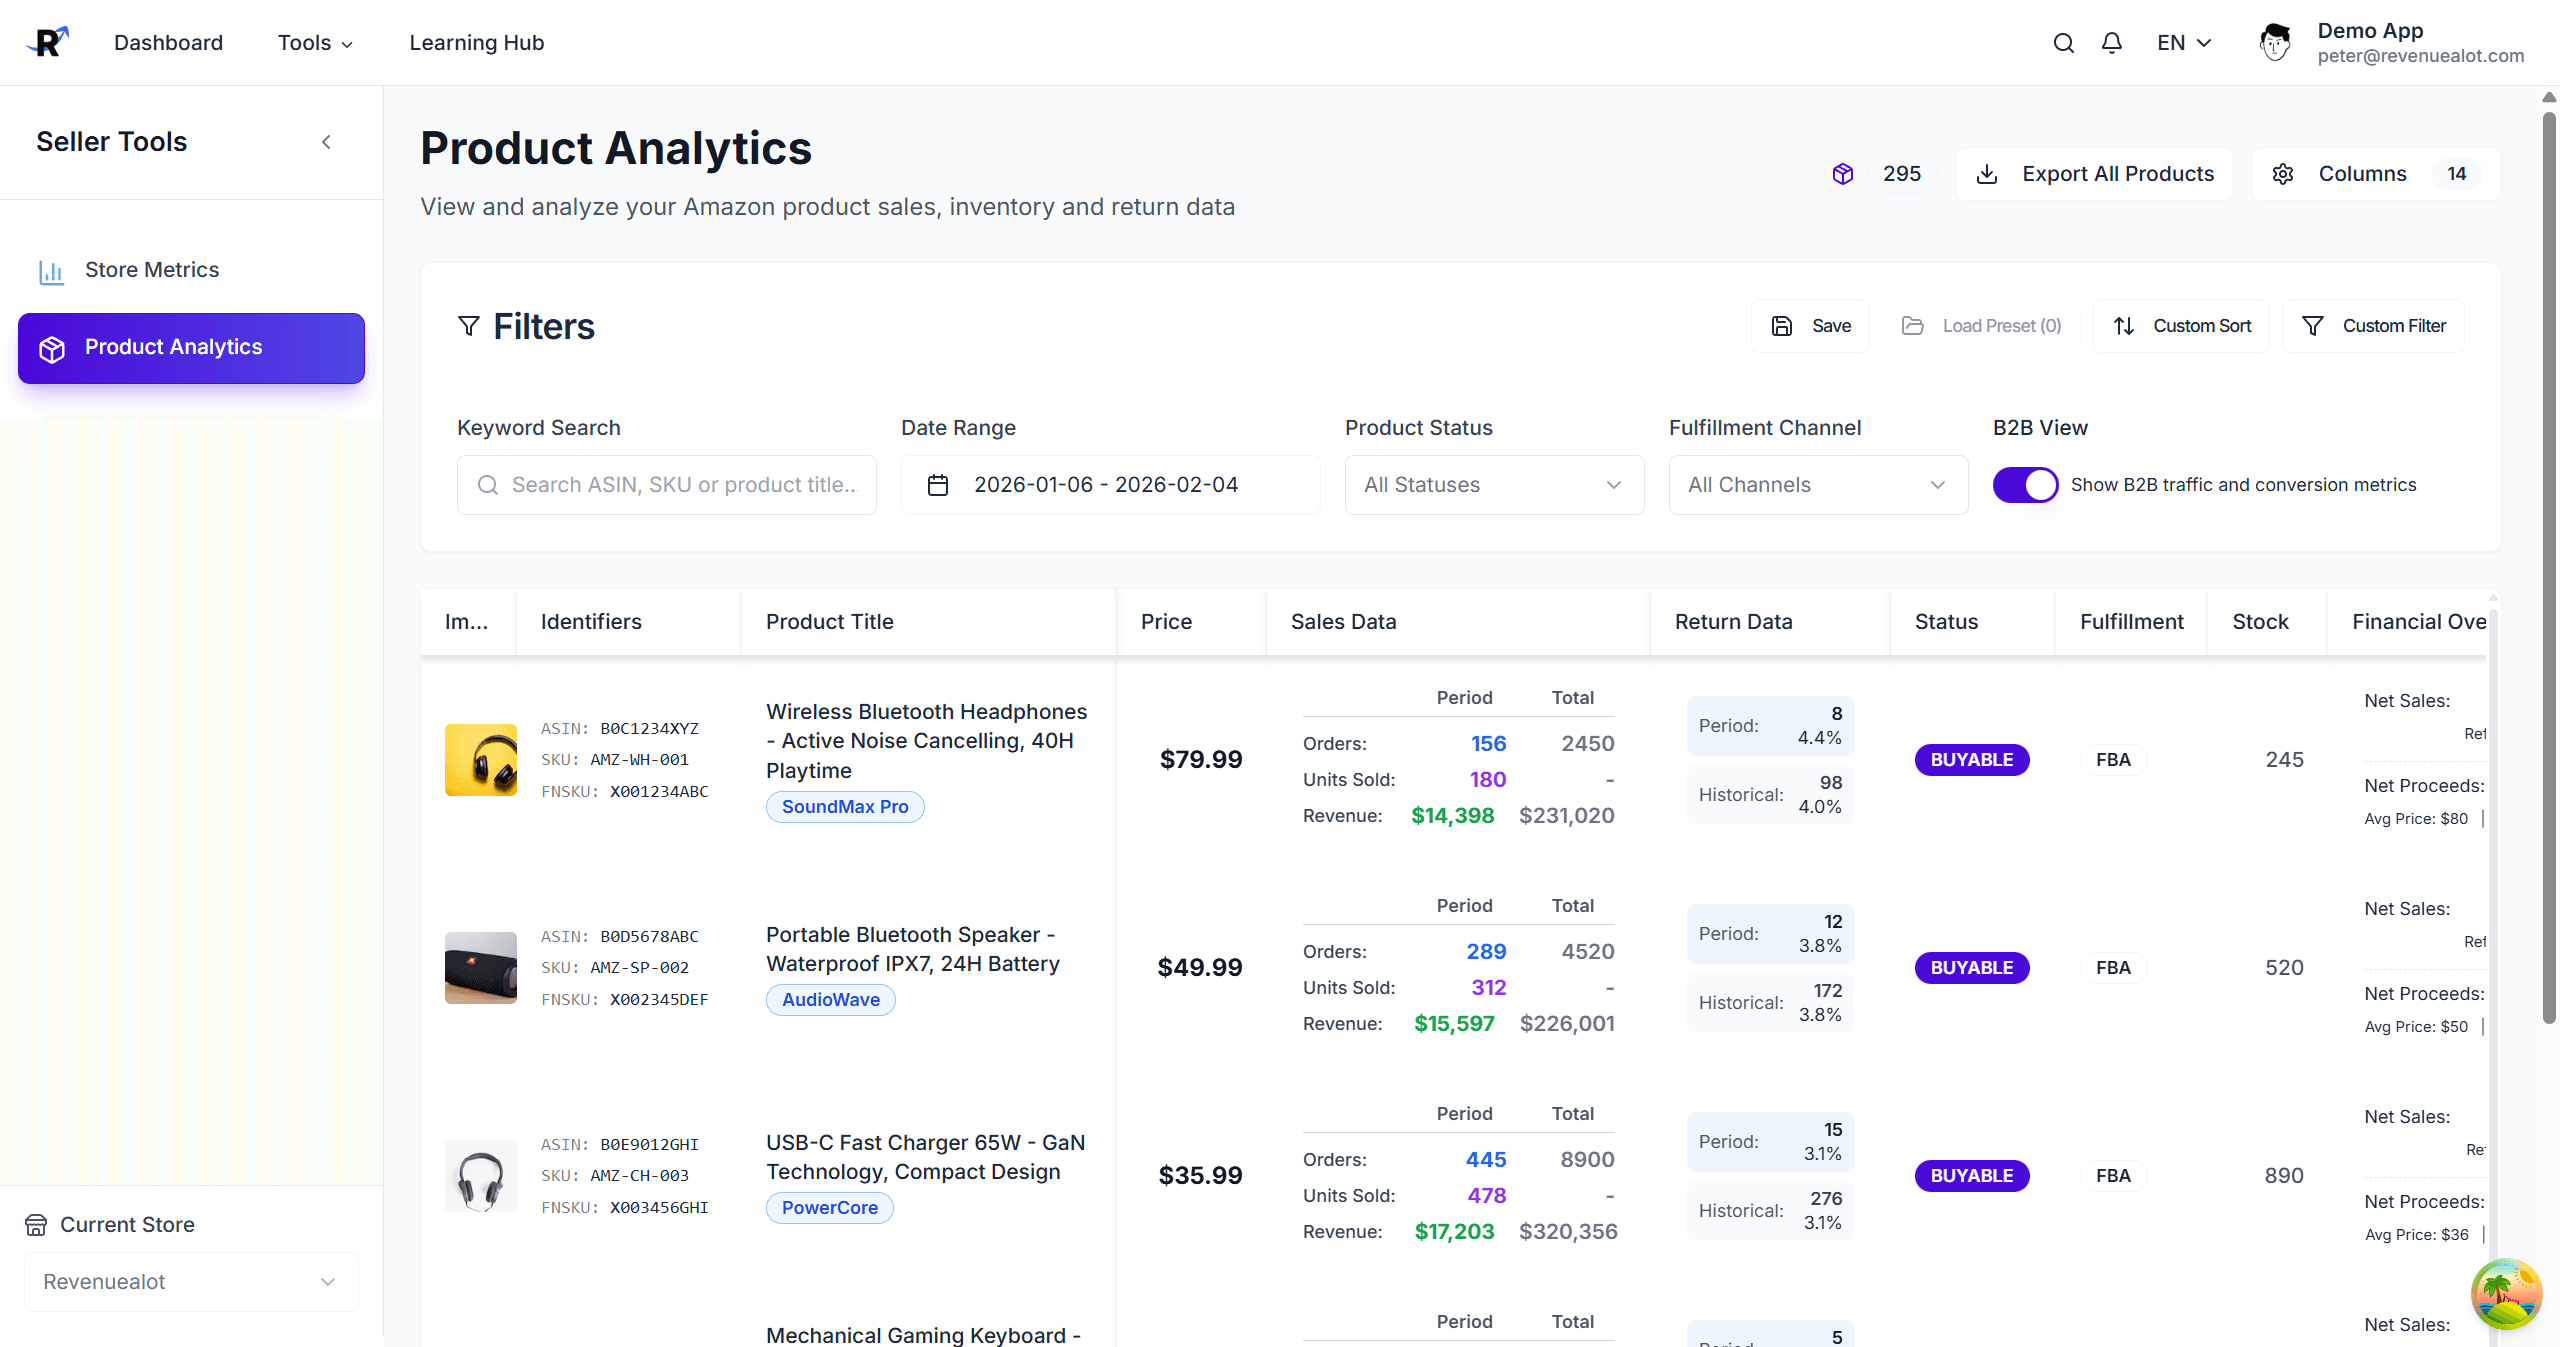
The Amazon Product Analytics page focuses on product-level sales, returns, inventory, and performance trends.
Prerequisites
- Amazon store is connected
- Select the target store at the top of the page
Core Capabilities
- Filters and sorting: Keyword, status, fulfillment channel, date range, custom conditions
- Column configuration: 5 column groups with 3 presets
- B2B view: Toggle B2B data when available (affects traffic and conversion columns)
- Pagination: 20 / 50 / 100 rows per page
- Preference persistence: All filter, column, sort, and pagination settings are saved to localStorage per store
Filter System
Quick filters:
- Keyword search: Up to 5 keywords (no duplicates), searched across title, ASIN, and SKU
- Status: Filter by product status (e.g. BUYABLE)
- Fulfillment channel: FBA or FBM
- Date range: Default last 30 days (excluding today)
- B2B toggle: Switch between B2C and B2B data views
Custom conditions — filter by basic info, sales, refunds, physical returns, ads, and traffic fields:
| Category | Fields | Operators |
|---|---|---|
| Basic Info | title, ASIN, SKU, brand | =, !=, contains, not_contains, is_set, is_not_set |
| Price & Inventory | price, quantity | =, !=, >, >=, <, <=, between |
| Status | status, fulfillment channel | =, != |
| Period Sales | totalRevenue, totalQuantity, orderCount | >, >=, <, <=, between |
| Period Refunds | refundQuantityInPeriod, refundAmountInPeriod, refundRateInPeriod | >, >=, <, <=, between |
| Period Physical Returns | returnQuantityInPeriod, returnRateInPeriod | >, >=, <, <=, between |
| Historical Sales | historicalRevenue, historicalQuantity, historicalOrderCount | >, >=, <, <=, between |
| Historical Refunds | historicalRefundQuantity, historicalRefundAmount, historicalRefundRate | >, >=, <, <=, between |
| Historical Physical Returns | historicalReturnQuantity, historicalReturnRate | >, >=, <, <=, between |
| Economics & Ads | netProceeds, adsTotal, TACOS | >, >=, <, <=, between |
| Traffic & Conversion | sessions, conversionRate, buyBoxPercentage | >, >=, <, <=, between |
Column Groups and Presets
The table organizes 16 columns into 5 groups:
| Group | Columns |
|---|---|
| Basic Info (6) | Image, Title, Identifiers (ASIN/SKU/UPC/FNSKU), Brand, Status, Fulfillment |
| Product Details (2) | Price, Dimensions (L x W x H + weight) |
| Sales Data (3) | Stock, Sales Overview, Refund / Physical Return Overview |
| Economics (3) | Financial Overview, Cost Structure, Advertising |
| Traffic & Conversion (2) | Traffic, Conversion |
Three presets for quick configuration:
| Preset | Columns shown | Use case |
|---|---|---|
| Minimal | Image, Title, Status, Price, Stock (5) | Quick glance |
| Standard | Basic Info + Price + Stock + Sales + Economics + Conversion (11) | Daily use |
| Comprehensive | All 16 columns | Full analysis |
Table Column Details
Sales Overview — displays period and historical data side by side:
- Orders, Quantity, Revenue for the selected period (blue)
- Same metrics for historical total (gray)
Refund / Physical Return Overview — separates Payments refunds from FBA/MFN physical returns:
- Refund quantity and refund amount: attributed by Payments posted_date, used for operating loss analysis
- Physical return quantity and physical return rate: attributed by FBA/MFN return_date, used for quality and fulfillment analysis
Financial Overview (Economics) — Net Product Sales, Refunds (if any), Net Proceeds Total, Average Selling Price, Unit Net Proceeds. Green = profit, Red = loss.
Cost Structure — COGS, FBA shipping, MFN fulfillment, MFN storage, miscellaneous costs, total fees, and total cost (costs + fees). Orange for cost items.
Advertising — Total ad spend (SP + SB + SD breakdown in detail popup) and TACOS with color thresholds:
- TACOS ≤ 15%: green
- TACOS ≤ 30%: amber
- TACOS > 30%: red
Traffic — Sessions and Page Views with browser / mobile app split. Supports B2B variant when toggled.
Conversion — Conversion Rate (Unit Session Percentage) and Buy Box %, both with color thresholds:
- Conversion Rate: ≥ 10% green, ≥ 5% amber, < 5% red
- Buy Box: ≥ 90% green, ≥ 70% amber, < 70% red
Some metrics depend on Sales & Traffic / Economics or Ads data sync and may be empty until synced.
Data Export
Export product analytics for the current date range and filters for offline analysis.
Export Field Scope (examples)
- Basics: ASIN, SKU, title, brand, status, fulfillment channel
- Price & inventory: price, quantity, FBA inventory
- Sales: revenue, units, order count
- Refunds and returns: refund quantity, refund amount, physical return quantity, physical return rate
- Historical totals: historical revenue, quantity, refunds, physical returns
Actual export fields may expand based on column settings and version updates.
Troubleshooting
Missing data
Confirm initial sync is complete and check your date range.
No results after filtering
Clear filters or broaden the date range and retry.
Next Steps
- 📣 Amazon Ads Dashboard - Compare ad performance with product trends
- 🚚 Amazon Inbound Shipments - Review FBA inbound and unreceived lines
- 📈 Amazon Store Metrics - Store-level performance
- 🔁 Listing Sync - Sync listings to Amazon